Live Response to Remotely Collect Defender Logs
Troubleshooting Defender issues often requires local logs — but collecting them manually can be time-consuming, especially when you can’t access the device directly. Fortunately, you can use MDE Live Response to remotely run the MDE Client Analyzer (MDECA) and collect logs directly through the Defender portal.
This guide will help you with the following scenarios:
- You need to troubleshoot Defender configuration, however the end-user device is not available.
- There is incident or alert from the user’s device, and you need to collect the relevant Defender logs asap.
Scope of this guide:
- Windows Client and Windows Server
- Endpoints onboarded and have active connection to MDE
- Fulfilled Live Response requirements
MS Docs Reference Link - Collect support logs in Microsoft Defender for Endpoint using live response
Step 1: Download the MDECA Script
Before using Live Response, you’ll need to upload the MDECA tool to the portal. Download the latest preview version from the link below:
Extract the zip and go to the Tools subfolder, you will see few .ps1 script that can be used with Live Response. Each of these scripts will collect regular MDECA plus additional logs depending on the scenario.
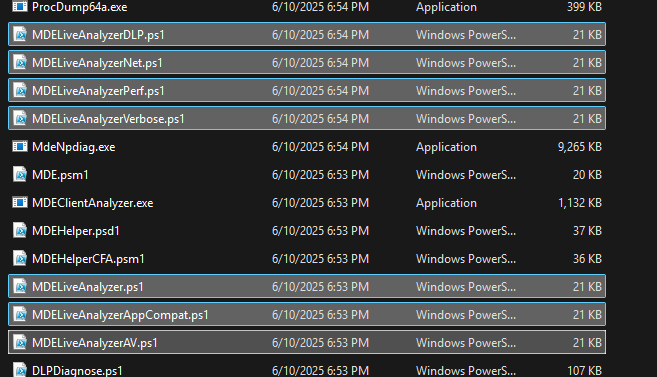
Such as:
- MDELiveAnalyzerNet.ps1 is similar with running MDECA with -i parameter, it will additionally collect network trace
- MDELiveAnalyzerAppCompat.ps1 is -c, it will collect procmon
- MDELiveAnalyzerPerf.ps1 and MDELiveAnalyzerAV.ps1 is -l, it will collect perfmon (not really sure why, but they are exactly the same script)
- MDELiveAnalyzerVerbose.ps1 is -l -e -v, it will collect perfmon, ETW event tracing and Defender verbose logs.
Info
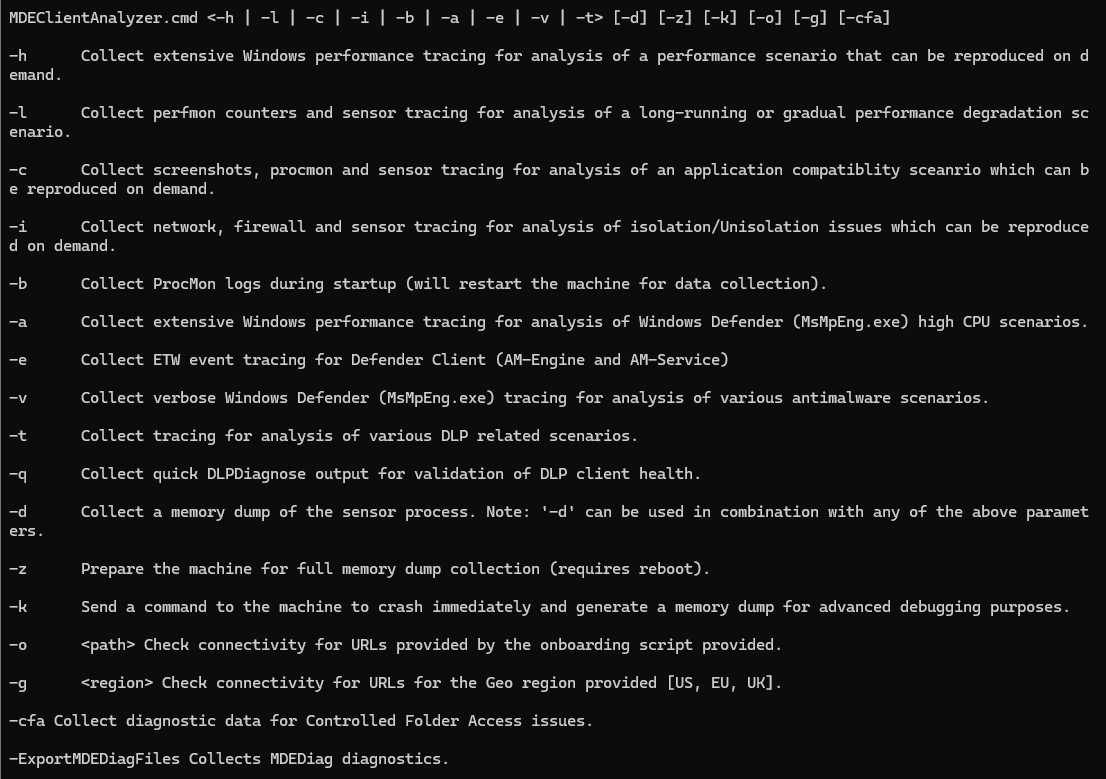
Running the following in your parent MDECA folder will show all available MDECA parameter:
MDEClientAnalyzer.cmd /?Click for screenshot
Step 2: Upload the Script to Defender Portal
In this example I will be using MDELiveAnalyzerNet.ps1 script to collect Defender logs plus additional network traces. Go to MDE Portal > Assets > Devices, select the Device you wish to collect logs from.
On Top right hand corner, click … > Initiate Live Response Session
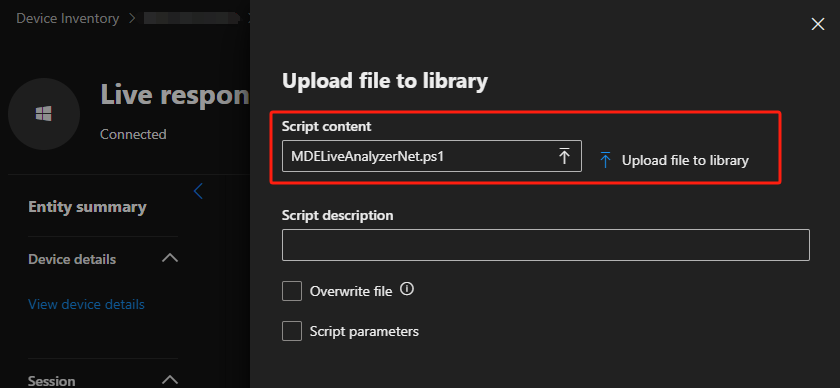
To check if file is successfully uploaded, run the following command inside the Live Response session. You should be able to see MDELiveAnalyzerNet.ps1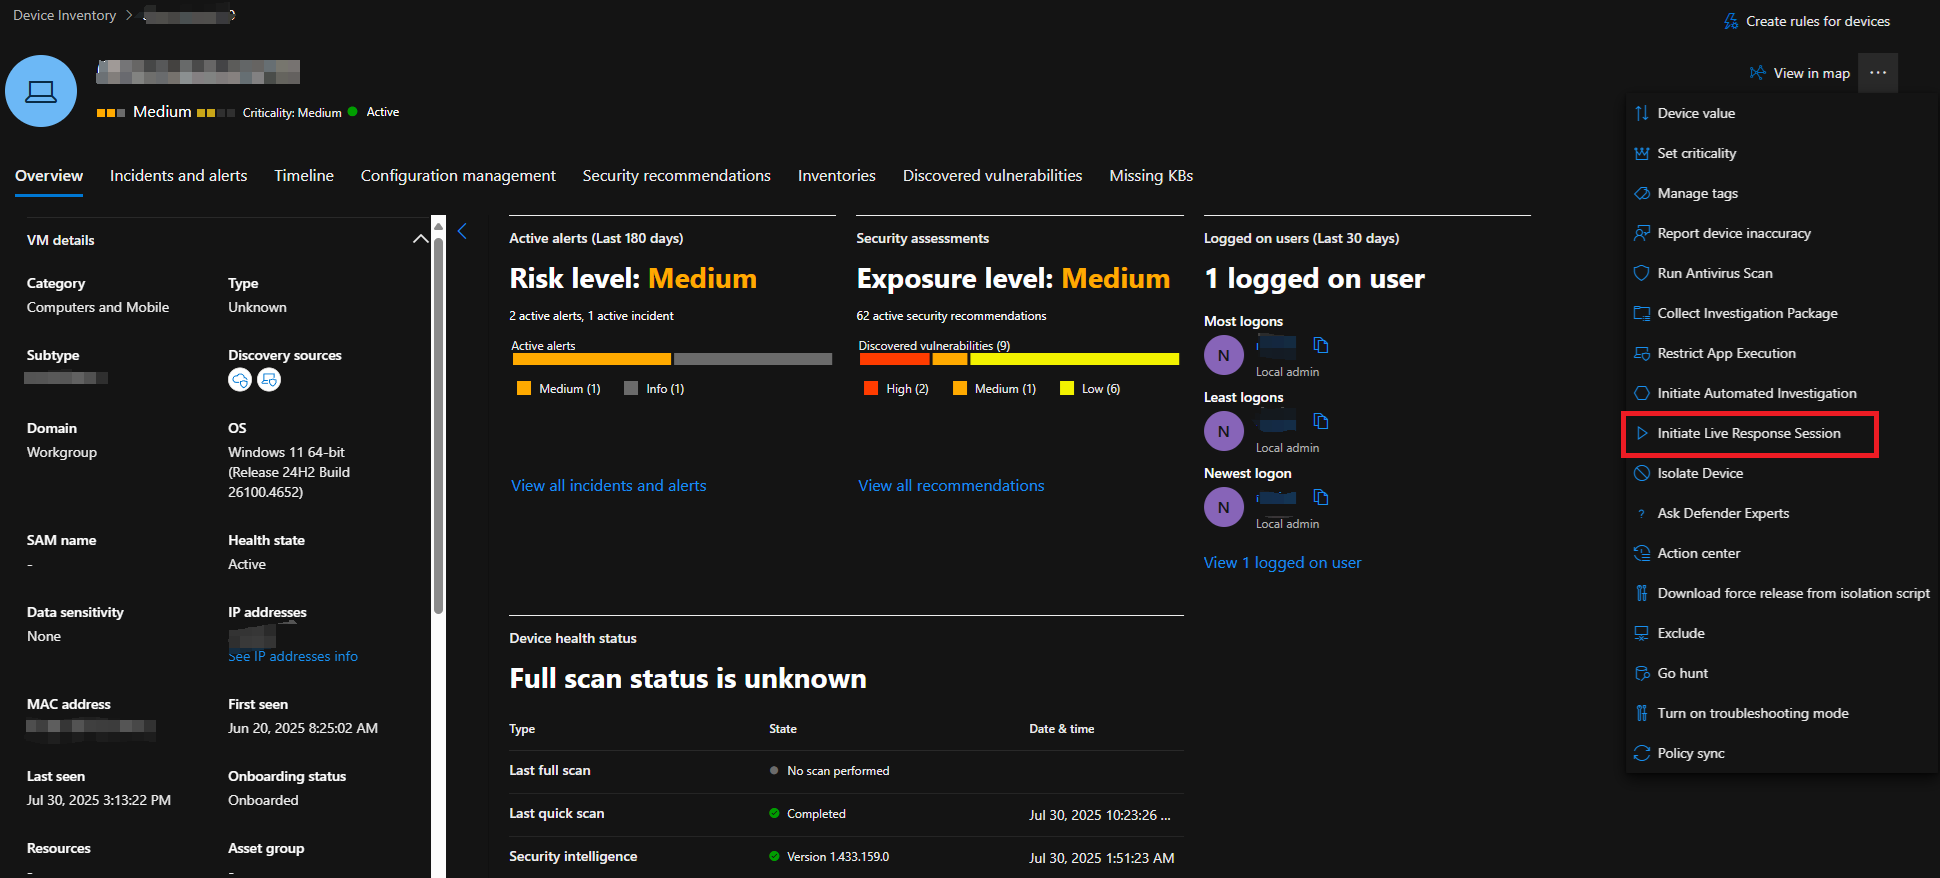 Once Live Response initiated, again click … > Upload file to library, in this example I selected MDELiveAnalyzerNet.ps1 > Submit
Info
library
Step 3: Running the Script and Download the Logs
Next you want to run the script, in the MS learn reference docs it was advised to use & symbol as suffix to run it as Live Response background action. The & suffix runs the command in the background, allowing you to keep using the Live Response session. Without it, you’ll need to wait until the script completes before doing anything else.
run MDELiveAnalyzerNet.ps1&I will show you both how it run with and without & parameter so you could get more familiar with it.
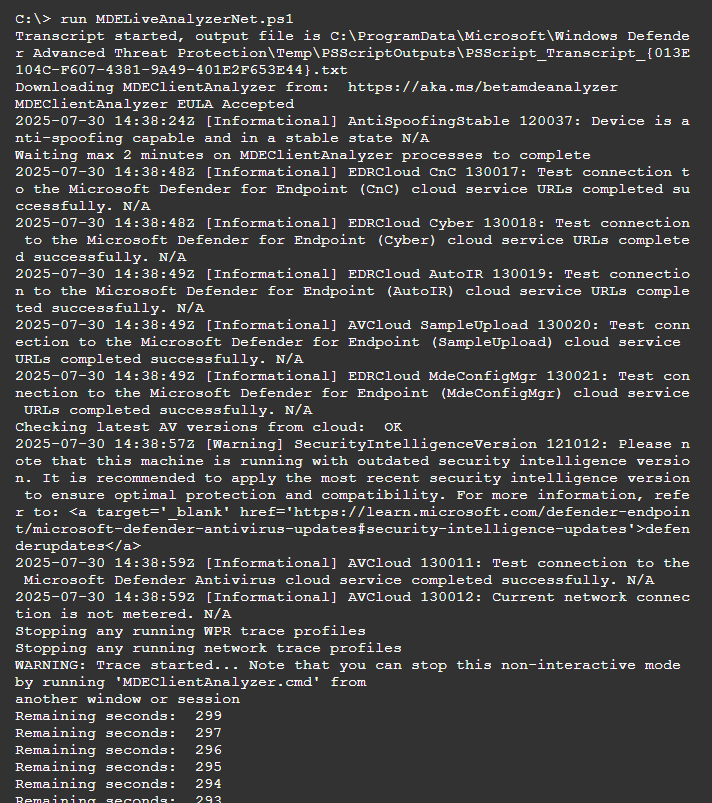
Without &, Live Response will show the output of the running script, and you could do nothing with the Live Response interface while waiting, until the script finishes running.
run MDELiveAnalyzerNet.ps1Click for screenshot
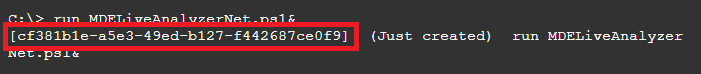
With the & suffix, once you run it, Live response will give you Command ID (GUID). And you are free to continue using the Live Response interface. You can then return to this background task by using fg command.
run MDELiveAnalyzerNet.ps1&Click for screenshot
 Using above example, here is the command to enter the background command:
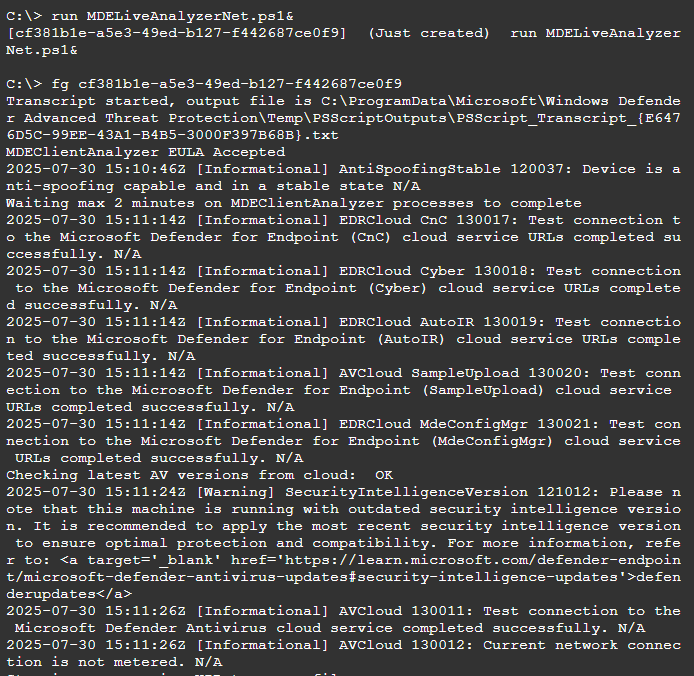
fg cf381b1e-a5e3-49ed-b127-f442687ce0f9Once this is run, it will show the command output
 \
\
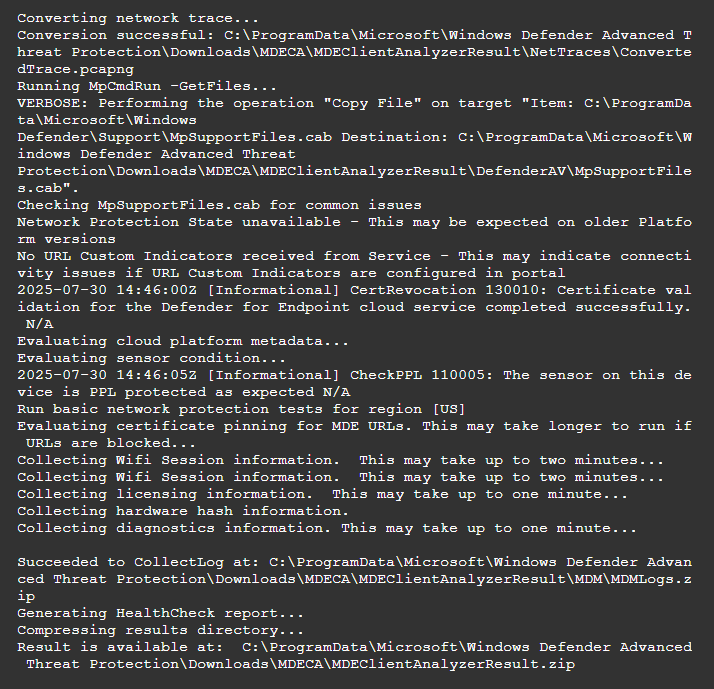
Next use this command to Download the MDE Client Analyzer output, in my demo lab it took 1-2 minutes before it starts downloading.
GetFile "C:\ProgramData\Microsoft\Windows Defender Advanced Threat Protection\Downloads\MDECA\MDEClientAnalyzerResult.zip"Also, in my test, the downloaded file is in .gz format, you can use Zip application to extract them.
Wrapping Up: Say Goodbye to Waiting on the User
You now have a reliable method for remote collection of MDECA logs using Live Response. This is extremely useful in scenarios where you need visibility into Defender behavior but can’t access the machine directly.
Be aware that MDECA can produce very detailed logs — make sure you understand what you’re looking for. For some basic MDECA logs details you can refer to the Official Docs.
For example, if you are looking to troubleshoot Defender AV configuration deployment settings, you can go to the /DefenderAV/ folder, and extract the MpSupportFiles.cab.